9.2 Poisson Distribution
To gain some intuition about the Poisson regression model consider the Poisson distribution
\[ P(\mathrm{y}|\mu) = \frac{e^{-\mu}\mu^{\mathrm{y}}}{\mathrm{y}!} \] where
- \(y\) is a random count variable
- \(\mu\) is the expected number of times an event ocurrs
- \(y! = y \times (y-1) \times ... \times 1\) is the factorical operator
The Poisson distribution relies on a single parameter, \(\mu\). Importantly, \(\mu\) represents both the mean and the variance of the Poisson distribution (e.g. when \(\mu\) is large both the mean and variance are large).
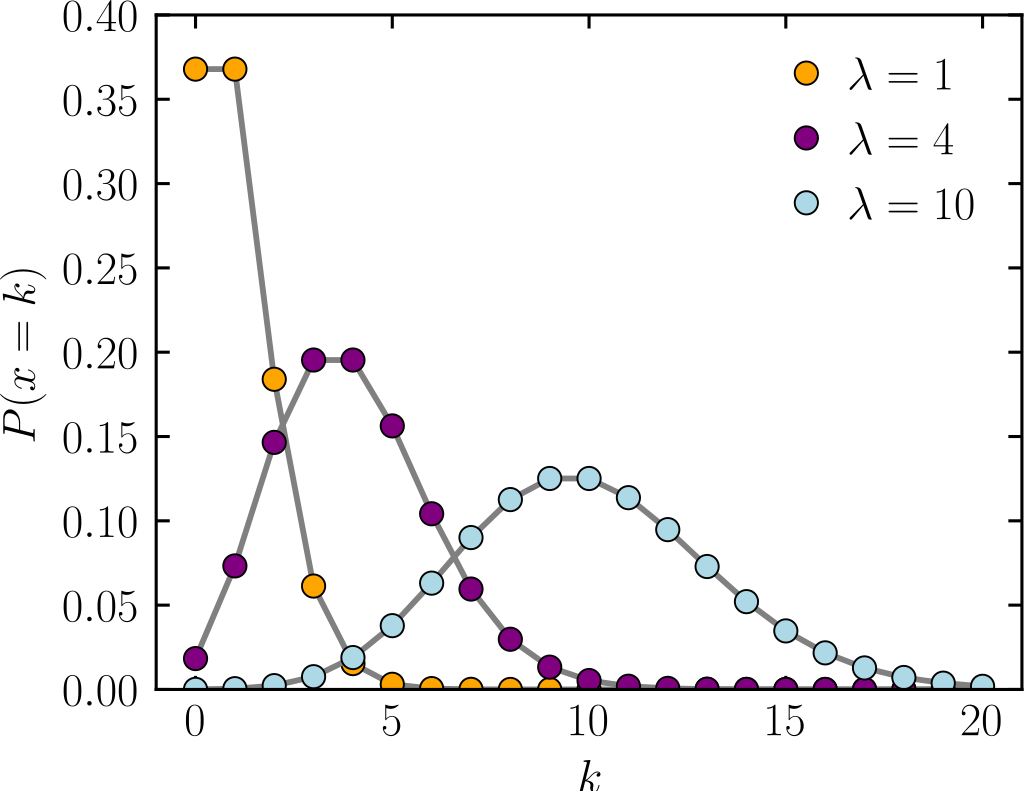
What Does This Mean In Practice:
- As \(\mu\) grows the center of the distribution shifts to right
- Departure of real count data from predictions from Poisson distribution
- Variance frequently greater than mean (overdisperion)
- Frequency of 0 counts exceed number predicted by Poisson