13.6 Quadratic Growth Model
Quadratic time model (MLM): random intercepts and linear and quadratic slopes.
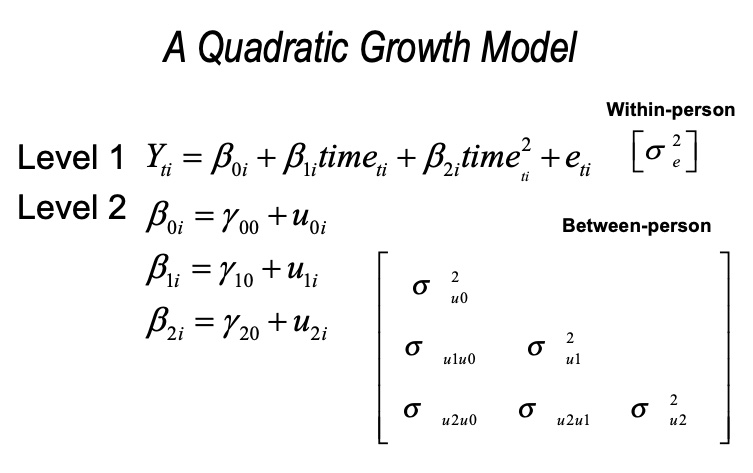
Quadratic Growth Model
verblong$gradeSquared <- (verblong$grade)^2

fq_rq_fit <- lme(
  fixed = verb ~ 1 + grade + gradeSquared,
  random = ~ 1 + grade|id + gradeSquared|id,
  data=verblong,
  na.action = na.exclude,
  method = "ML"
)
summary(fq_rq_fit)
## Linear mixed-effects model fit by maximum likelihood
## Data: verblong
## AIC BIC logLik
## 5226.412 5259.343 -2606.206
##
## Random effects:
## Formula: ~1 + grade | id + gradeSquared | id
## Structure: General positive-definite, Log-Cholesky parametrization
## StdDev Corr
## (Intercept) 5.277258 (Intr)
## 1 + grade | id + gradeSquaredTRUE 5.277258 -0.288
## Residual 4.491283
##
## Fixed effects: verb ~ 1 + grade + gradeSquared
## Value Std.Error DF t-value p-value
## (Intercept) 16.347780 0.7508427 610 21.772576 0.0000
## grade 3.695700 0.4344000 610 8.507596 0.0000
## gradeSquared 0.138997 0.0606470 610 2.291899 0.0223
## Correlation:
## (Intr) grade
## grade -0.750
## gradeSquared 0.695 -0.982
##
## Standardized Within-Group Residuals:
## Min Q1 Med Q3 Max
## -2.79052272 -0.55253516 -0.02974189 0.51054065 4.07582660
##
## Number of Observations: 816
## Number of Groups: 204Let’s look at the predicted trajectories.
verblong$pred_fq_rq <- predict(fq_rq_fit)
verblong$resid_fq_rq <- residuals(fq_rq_fit)
fun_fq_rq <- function(x) {
fixef(fq_rq_fit)[[1]] + fixef(fq_rq_fit)[[2]]*x + fixef(fq_rq_fit)[[3]]*x^2
}
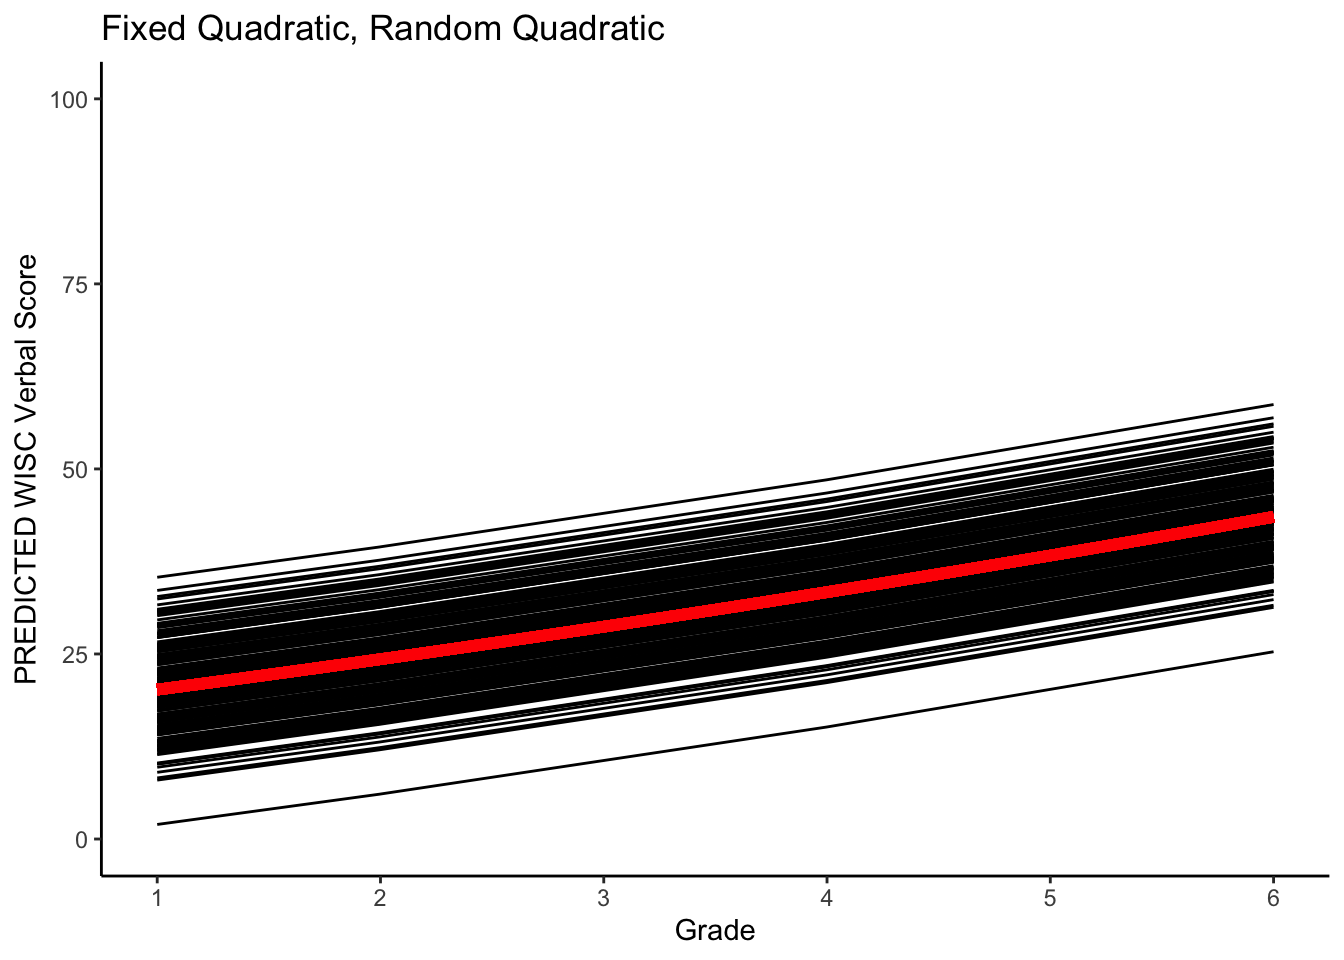
ggplot(data = verblong, aes(x = grade, y = pred_fq_rq, group = id)) +
ggtitle("Fixed Quadratic, Random Quadratic") +
geom_line() +
xlab("Grade") +
ylab("PREDICTED WISC Verbal Score") + ylim(0,100) +
scale_x_continuous(breaks=seq(1,6,by=1)) +
stat_function(fun=fun_fq_rq, color="red", size = 2) +
theme_classic()## Warning: Multiple drawing groups in `geom_function()`
## ℹ Did you use the correct group, colour, or fill aesthetics?